The Truth About Marijuana Potency Claims

In Canada, a former corrections officer and pro-drug-legalization advocate objected to warnings that the potency of marijuana was tripling and quadrupling, resulting in a dangerously potent drug. John Anderson responded to this news by saying, “If you look at the difference between one and four percent, that’s 300 percent so I suppose they have an argument there.” He was quoted by Day6 of Canadian radio station CBC.
Let’s look at the truth or accuracy of his statement.
Marijuana’s Potency
It’s not exactly correct to say that pot’s potency has increased 300%. It’s also inaccurate to scoff about marijuana potency increasing from one percent to four percent. The situation we have is truly far more serious.
The correct percentage of increase all depends on the which year you choose for comparison with today’s pot. It also depends on which cannabis product you use—regular marijuana or sinsemilla (leaves from unfertilized, seedless female plants).
For some reason, many news sources often choose to start their comparisons with a date in the early 1990s when the potency was running between three and four percent.
If you want to really see the progression of the potency of marijuana, then let’s go back to the earliest available figures from the Mississippi Monitoring Project, the national authority on these numbers.
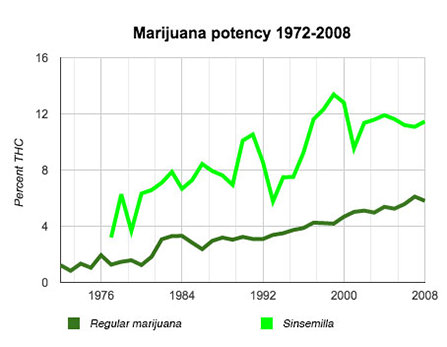
Here’s a chart showing the increasing content of tetrahydrocannabinol (THC, the main intoxicating ingredient) of seized samples of marijuana between 1972 and 2008. The dark green line shows the increasing potency of regular marijuana and the bright green line shows the potency of sinsemilla.
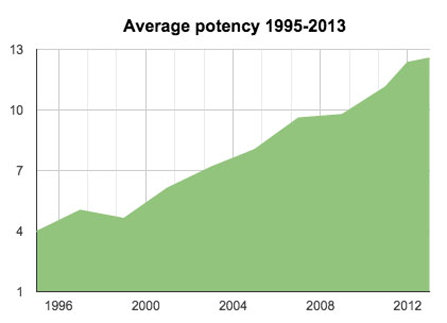
It’s very hard to find the exact same chart starting in 1972 and carrying through 2013. A separate chart published by the Jefferson County Marijuana Task Force shows the increase the average THC found in seized samples between 1995 and 2013. We’ll pick up the continued increase of potency from their numbers.
Not Exactly an Increase from 1% to 4%
Put these two charts together and you can see that the average THC content has increased from 1.23% in 1972 (and 1973 was even lower at .83%) to nearly 13% in 2013. This is an increase of 1020%.
Mr. Anderson commented on a 300% increase from 1% to 4%. The numbers he chose paint a vastly different picture than the one painted by the true potencies. The effects of smoking weed at 1%, 4% or 13% potency is very, very different.
The high figure above, 12.55% in 2013, is still far from the highest sample ever tested. The highest THC content measured as of March 15, 2009, was 37.2% THC. It is common for medical marijuana dispensaries to state potencies of 20% to 25%.
The moral of the tale is that sometimes it pays to look closely at what you are told by someone who is claiming that marijuana is a virtually harmless drug.
After describing these increases in potency, the National Institute on Drug Abuse stated: “So what does this actually mean? For a new user, it may mean exposure to higher concentrations of THC, with a greater chance of an adverse or unpredictable reaction. In fact, increases in potency may account for the rise in emergency department visits involving marijuana use. For experienced users, it may mean a greater risk for addiction if they are exposing themselves to high doses on a regular basis.”
Not at all harmless.
- http://www.briancbennett.com/charts/fed-data/thc-content/thc-content-sinsemilla.htm
- Jefferson County Marijuana Task Force, report to the Board of County Commissioners, Jefferson County, Colorado, Sept 8, 2014
- http://medicalmarijuana.procon.org/sourcefiles/UMPMC-quarterly-monitoring-report.pdf
- http://www.drugabuse.gov/sites/default/files/parents_marijuana_brochure.pdf