Latest Figures on Drug and Alcohol Deaths Reveal Surprising Statistics
The Centers on Disease Control and Prevention has just released final figures on the number of Americans we lost to drugs or alcohol in 2015. These figures were broken down by age, race, sex and ethnicity and compared to other annual numbers back to 1999. We know already that our losses are much worse now than they were in 1999 so how much worse are they? And is there anything else these numbers can teach us?
We’ll take a look at the numbers from a number of directions.
First, let’s compare alcohol-induced deaths to drug-induced deaths in 1999. Oddly, these numbers were almost identical. There were 19,469 alcohol-induced deaths and 19,128 drug-induced deaths.

After that, alcohol numbers climbed pretty steadily—a few or several hundred every year through 2014. But then between 2014 and 2015, the number jumped up nearly 2,500 deaths. In 2015, alcohol-induced deaths reached 33,171.
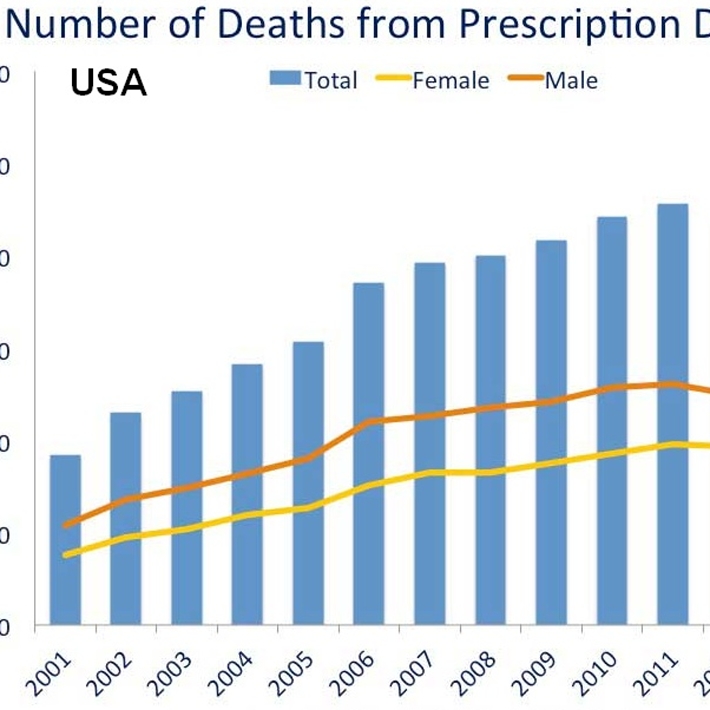
Drug-related deaths increased in a more accelerated and distressing pattern. Starting with 19,128 deaths in 1999, the number soared to 55,403 in 2015.
Here are the biggest jumps in drug-induced deaths:

- 2001 to 2002: increase of 4,335
- 2005 to 2006: increase of 4,855
- 2012 to 2013: increase of 2,652
- 2013 to 2014: increase of 3,243
- 2014 to 2015: increase of 5,689
It’s not hard to understand the increases in the last few years. These were the years that fentanyl and its analogues hit the market hard. These incredibly potent drugs were mixed into heroin or even cocaine supplies, pressed into counterfeit pills or simply being sold as straight fentanyl.
Ironically, the West Coast which sees more black tar heroin on the market and less whitish powder heroin has been spared the worst of the problems with fentanyl. It’s hard to mix anything into the black tar heroin that comes straight up the coast from Mexico.
Gender and Racial Groups: Who is More Vulnerable?

Figures for drug-related deaths in 2015 were nearly twice as high for men as for women—a typical trend. Beyond that, the racial and gender group taking the biggest hit was non-Hispanic American Indian men or Alaskan native which lost 8.1 people per 100,000 to drug-induced causes in 1999 but watched that number soar to 26.7 in 2015, a 330% increase.
In second place was non-Hispanic white men which in 1999 lost 9.2 people per 100,000 population. In 2015, that number was 27.1, a 294% increase.
Which group was spared the worst of this increase? Astonishingly, non-Hispanic Asians or Pacific Islanders have the tiniest numbers of losses. The increase between 1999 and 2015 was 230% which sounds high. However, per 100,000 population, the loss was only 1.3 in 1999 and 3.0 in 2015. In 2015, women from this group suffered losses of only .8 per 100,000.
The Tragedy of American Indians and Alaskan Natives
A closer look at the alcohol numbers reveals the incredible losses to the Native communities as a result of alcohol consumption.
For most groups, the rate of alcohol loss per 100,000 ranges from 7.9 for Hispanics to 17.2 for white men. For Native communities, it’s a completely different story.
In 2015, here were the numbers of losses per 100,000 population of American Indian or Alaskan Natives:
- Either gender: 43.8 alcohol deaths per 100,000
- Women: 30.5 alcohol deaths per 100,000
- Men: 57.7 alcohol deaths per 100,000
These numbers don’t refer to the rate of addiction, they refer to the rate of alcohol-caused deaths per 100,000 people of that group.
What Can We Do with These Numbers?
It can be useful to realize who is most at risk. It’s not that you would want to dismiss the risk to those groups with small numbers but it might be smart to ramp up one’s efforts to educate the groups at highest risk. If you or your group have a working relationship with non-Hispanic American Indians, Alaskan Natives or whites—especially men from these two groups—realize their vulnerability. For whatever reasons, these are the groups most susceptible to loss of life to drugs or alcohol.
The rapid rates of increase and the particularly high rate of loss among certain groups can certainly serve as a wakeup call to anyone who might be inspired to greater action. Hopefully, these numbers will motivate you to discover new ways you can spread the message that the greatest safety can be found in sobriety.

Sources Used
https://www.cdc.gov/nchs/data/nvsr/nvsr66/nvsr66_06.pdf